data and tech projects
Post-burn dashboard
Visualization of data from an fire ecology study undertaken in Central Florida from 2020-2022. Written in R with Shiny.
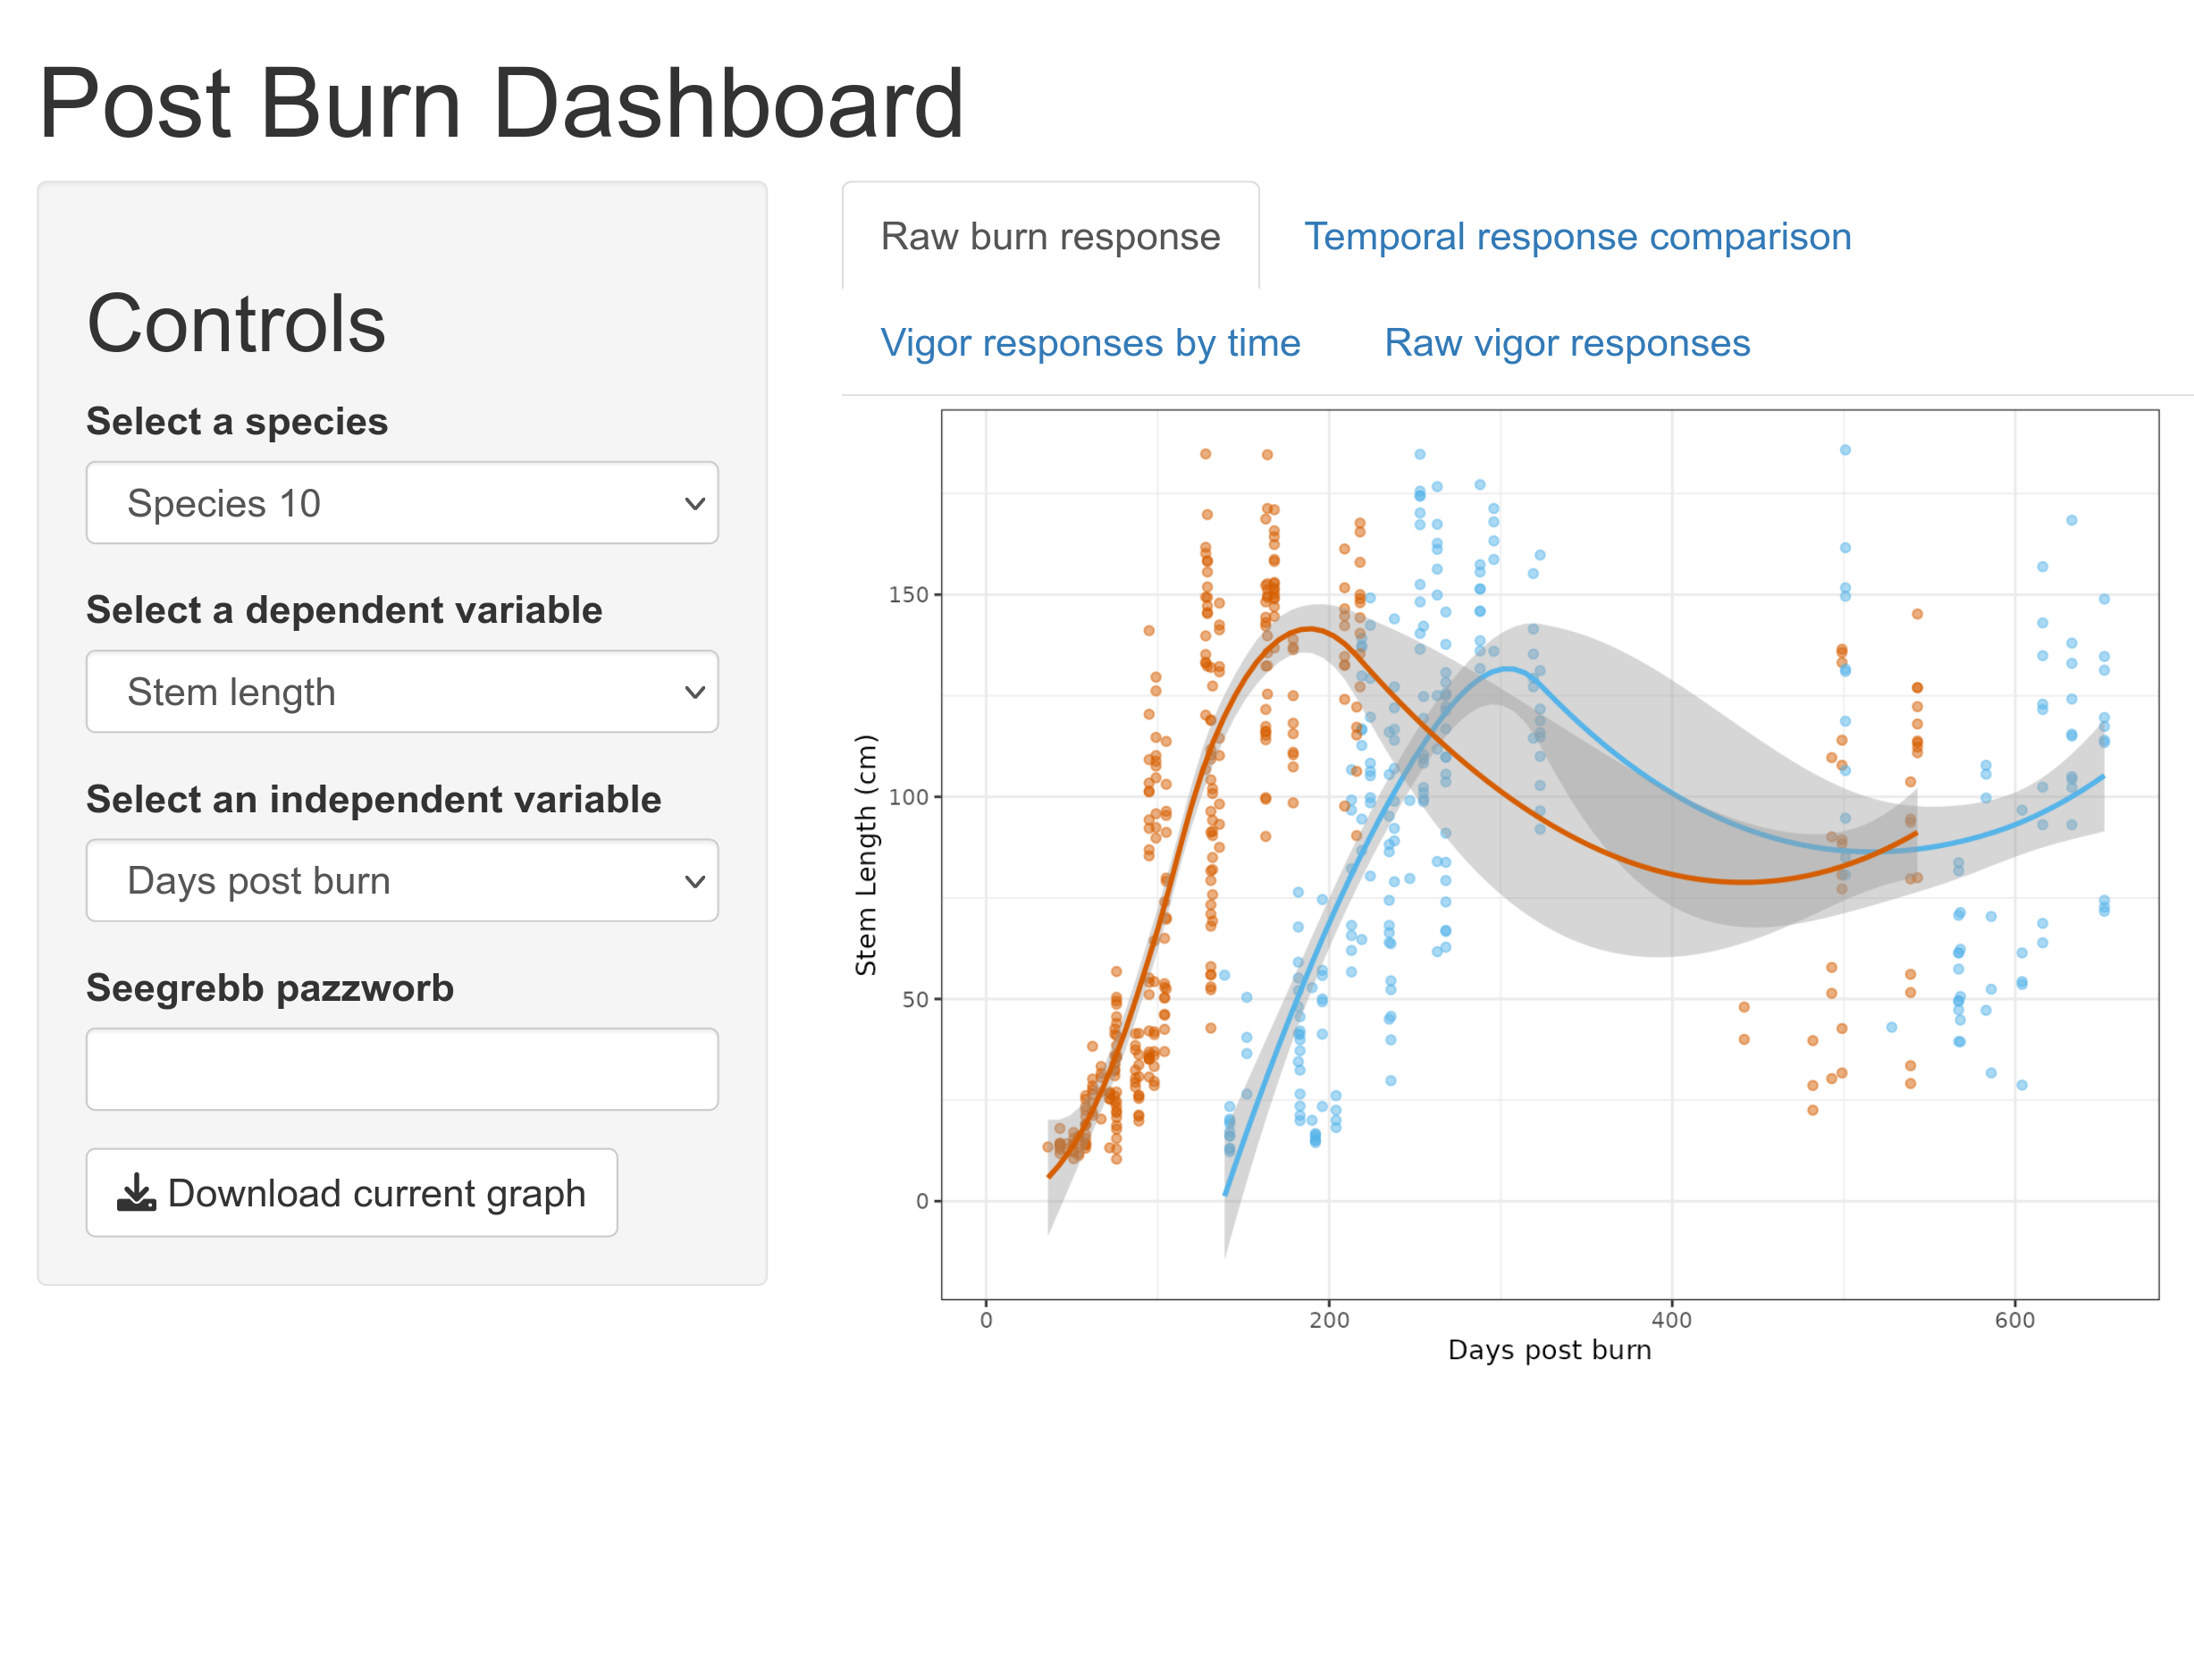
Central Florida's flatwoods ecosystems depend on regular fire to achieve stasis - many plant species require fire to reproduce. Though prescribed fire is used across the Southeast, the role of fire seasonality is not well described. This research project aimed to describe differences in phenological expression and vigor in key Florida flatwoods species such as wiregrass (Aristida beyrichiana), gayfeathers (Liatris spp.), and bluestem (Andropogon spp.)
I created an interactive dashboard that allows visualizing differences in phenology and vigor based on season of burn and species. The data are hosted on Shinyapps, a freemium hosting platform for shiny apps. Please be mindful of the time you spend exploring this app - I don't have unlimited free hosting time!
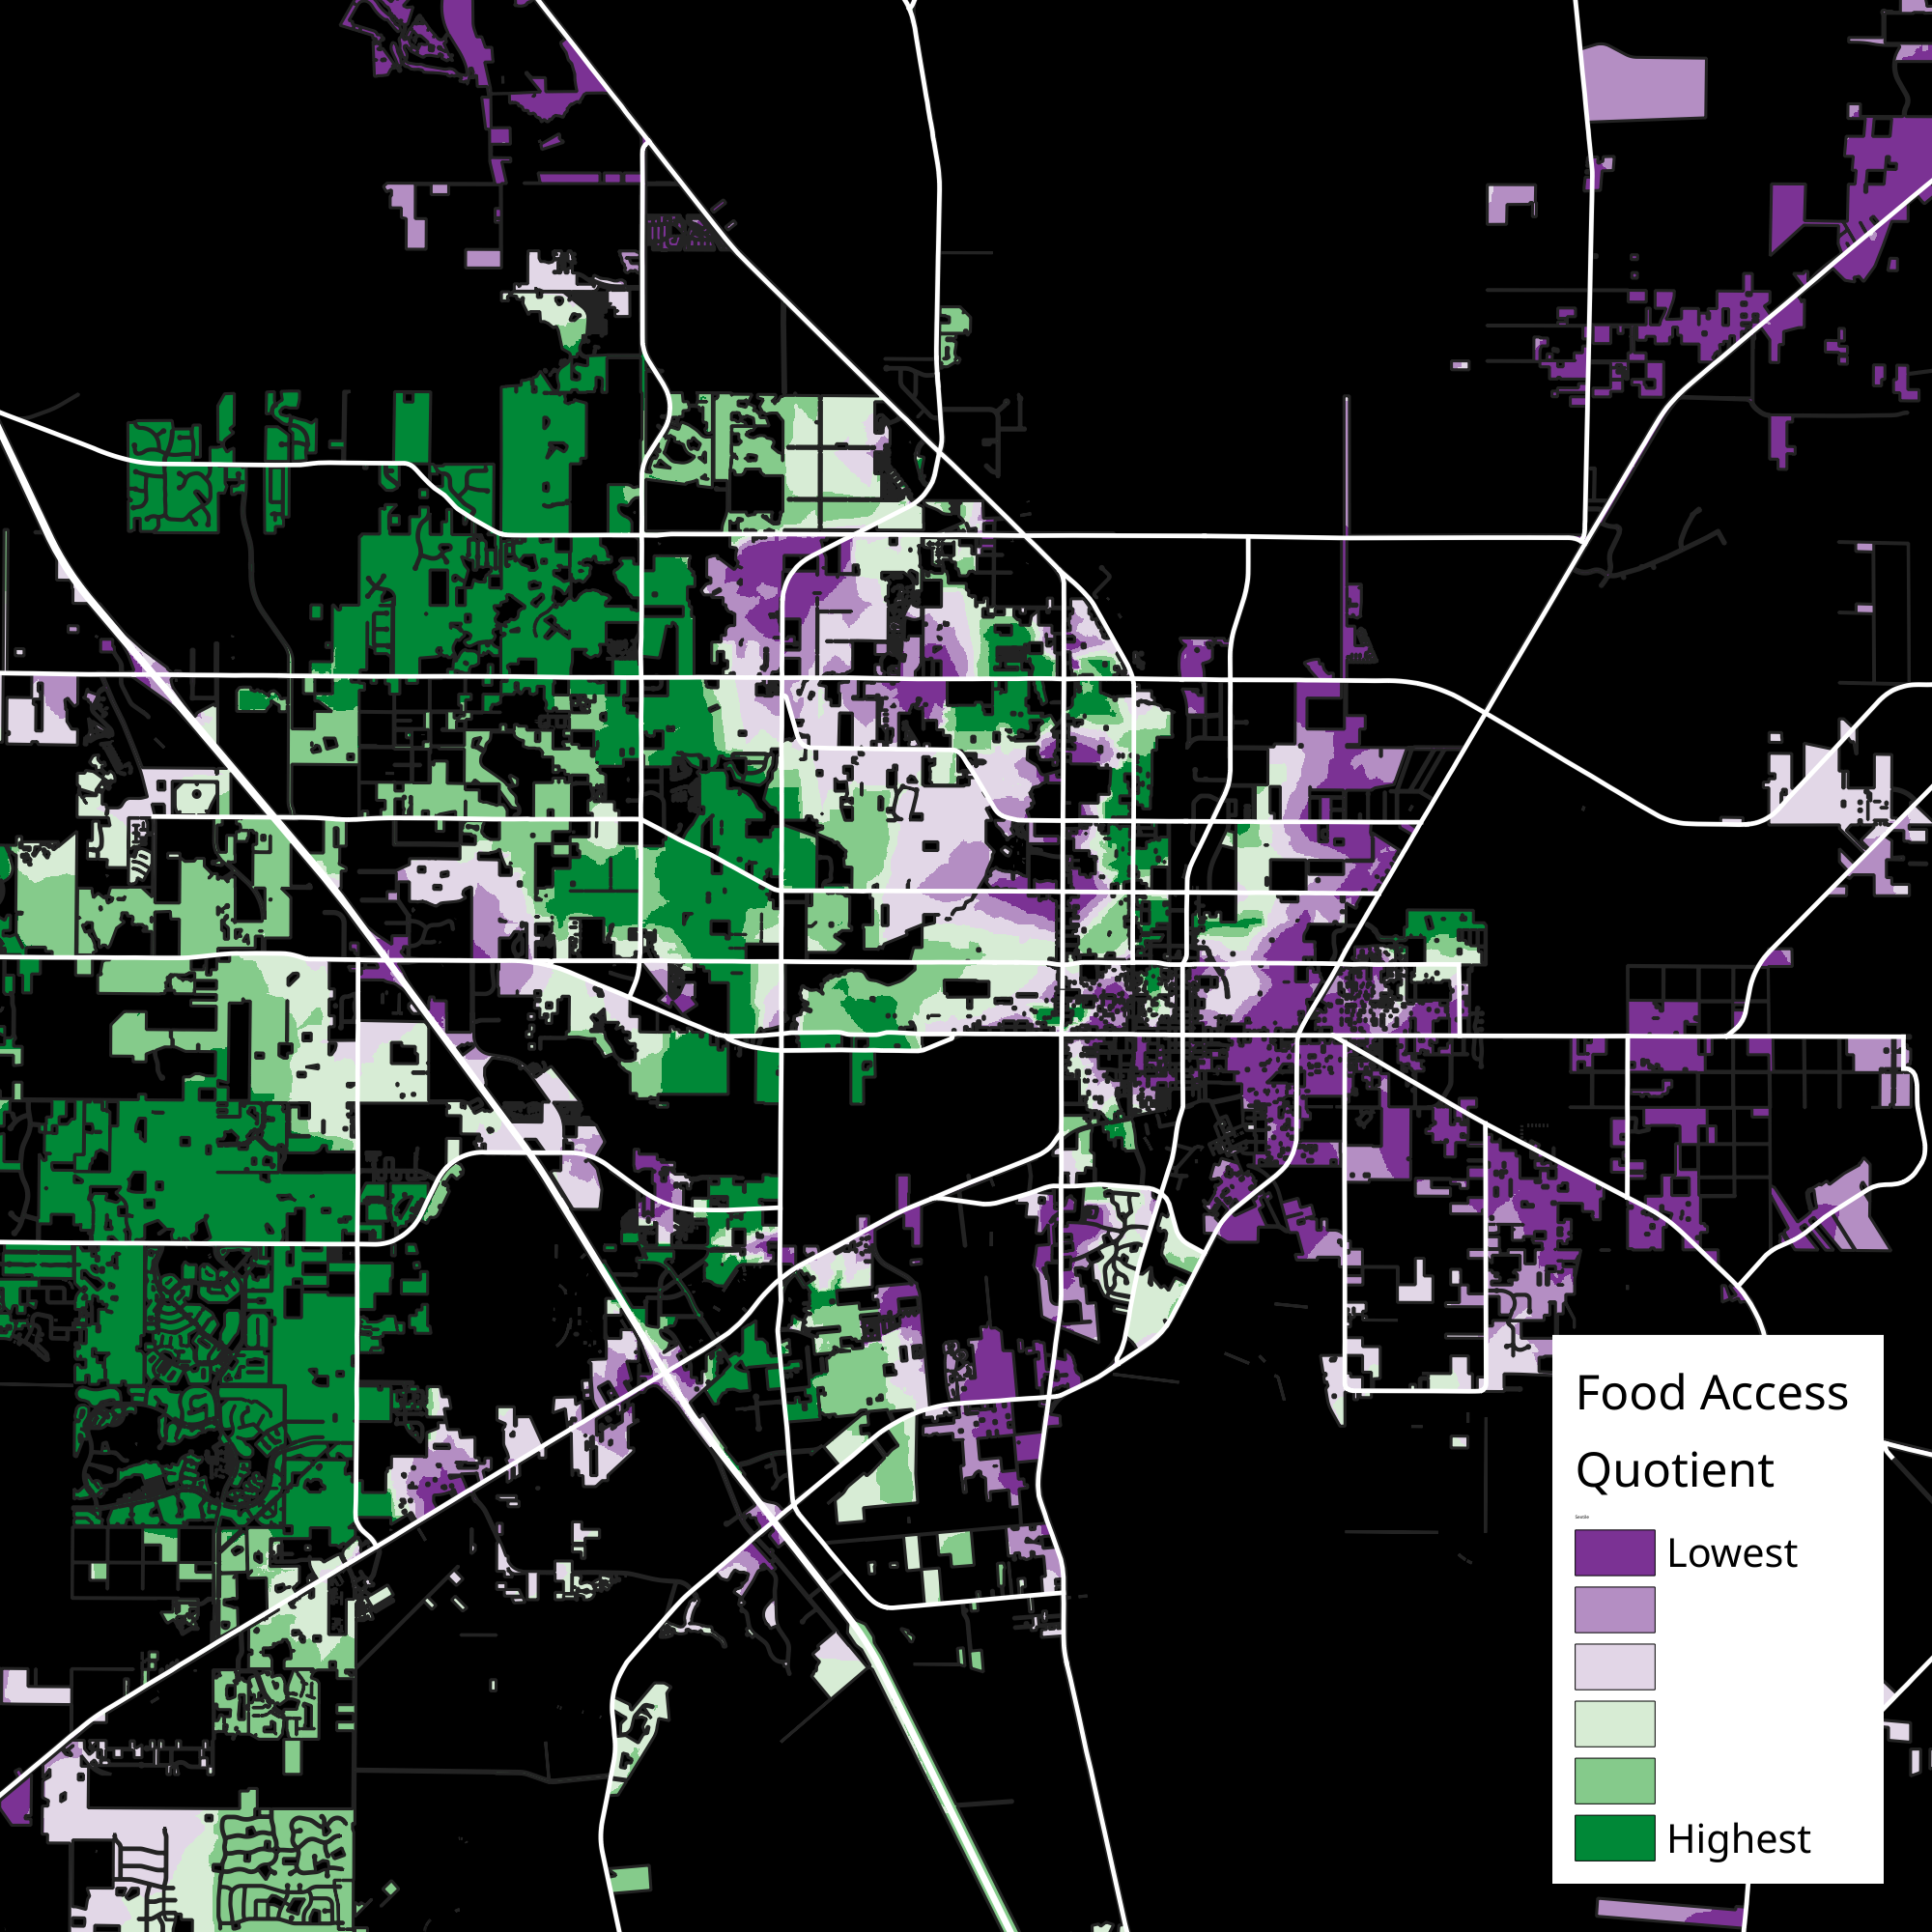
Foodshed of Alachua County
A map of food deserts and food swamps of Alachua County.
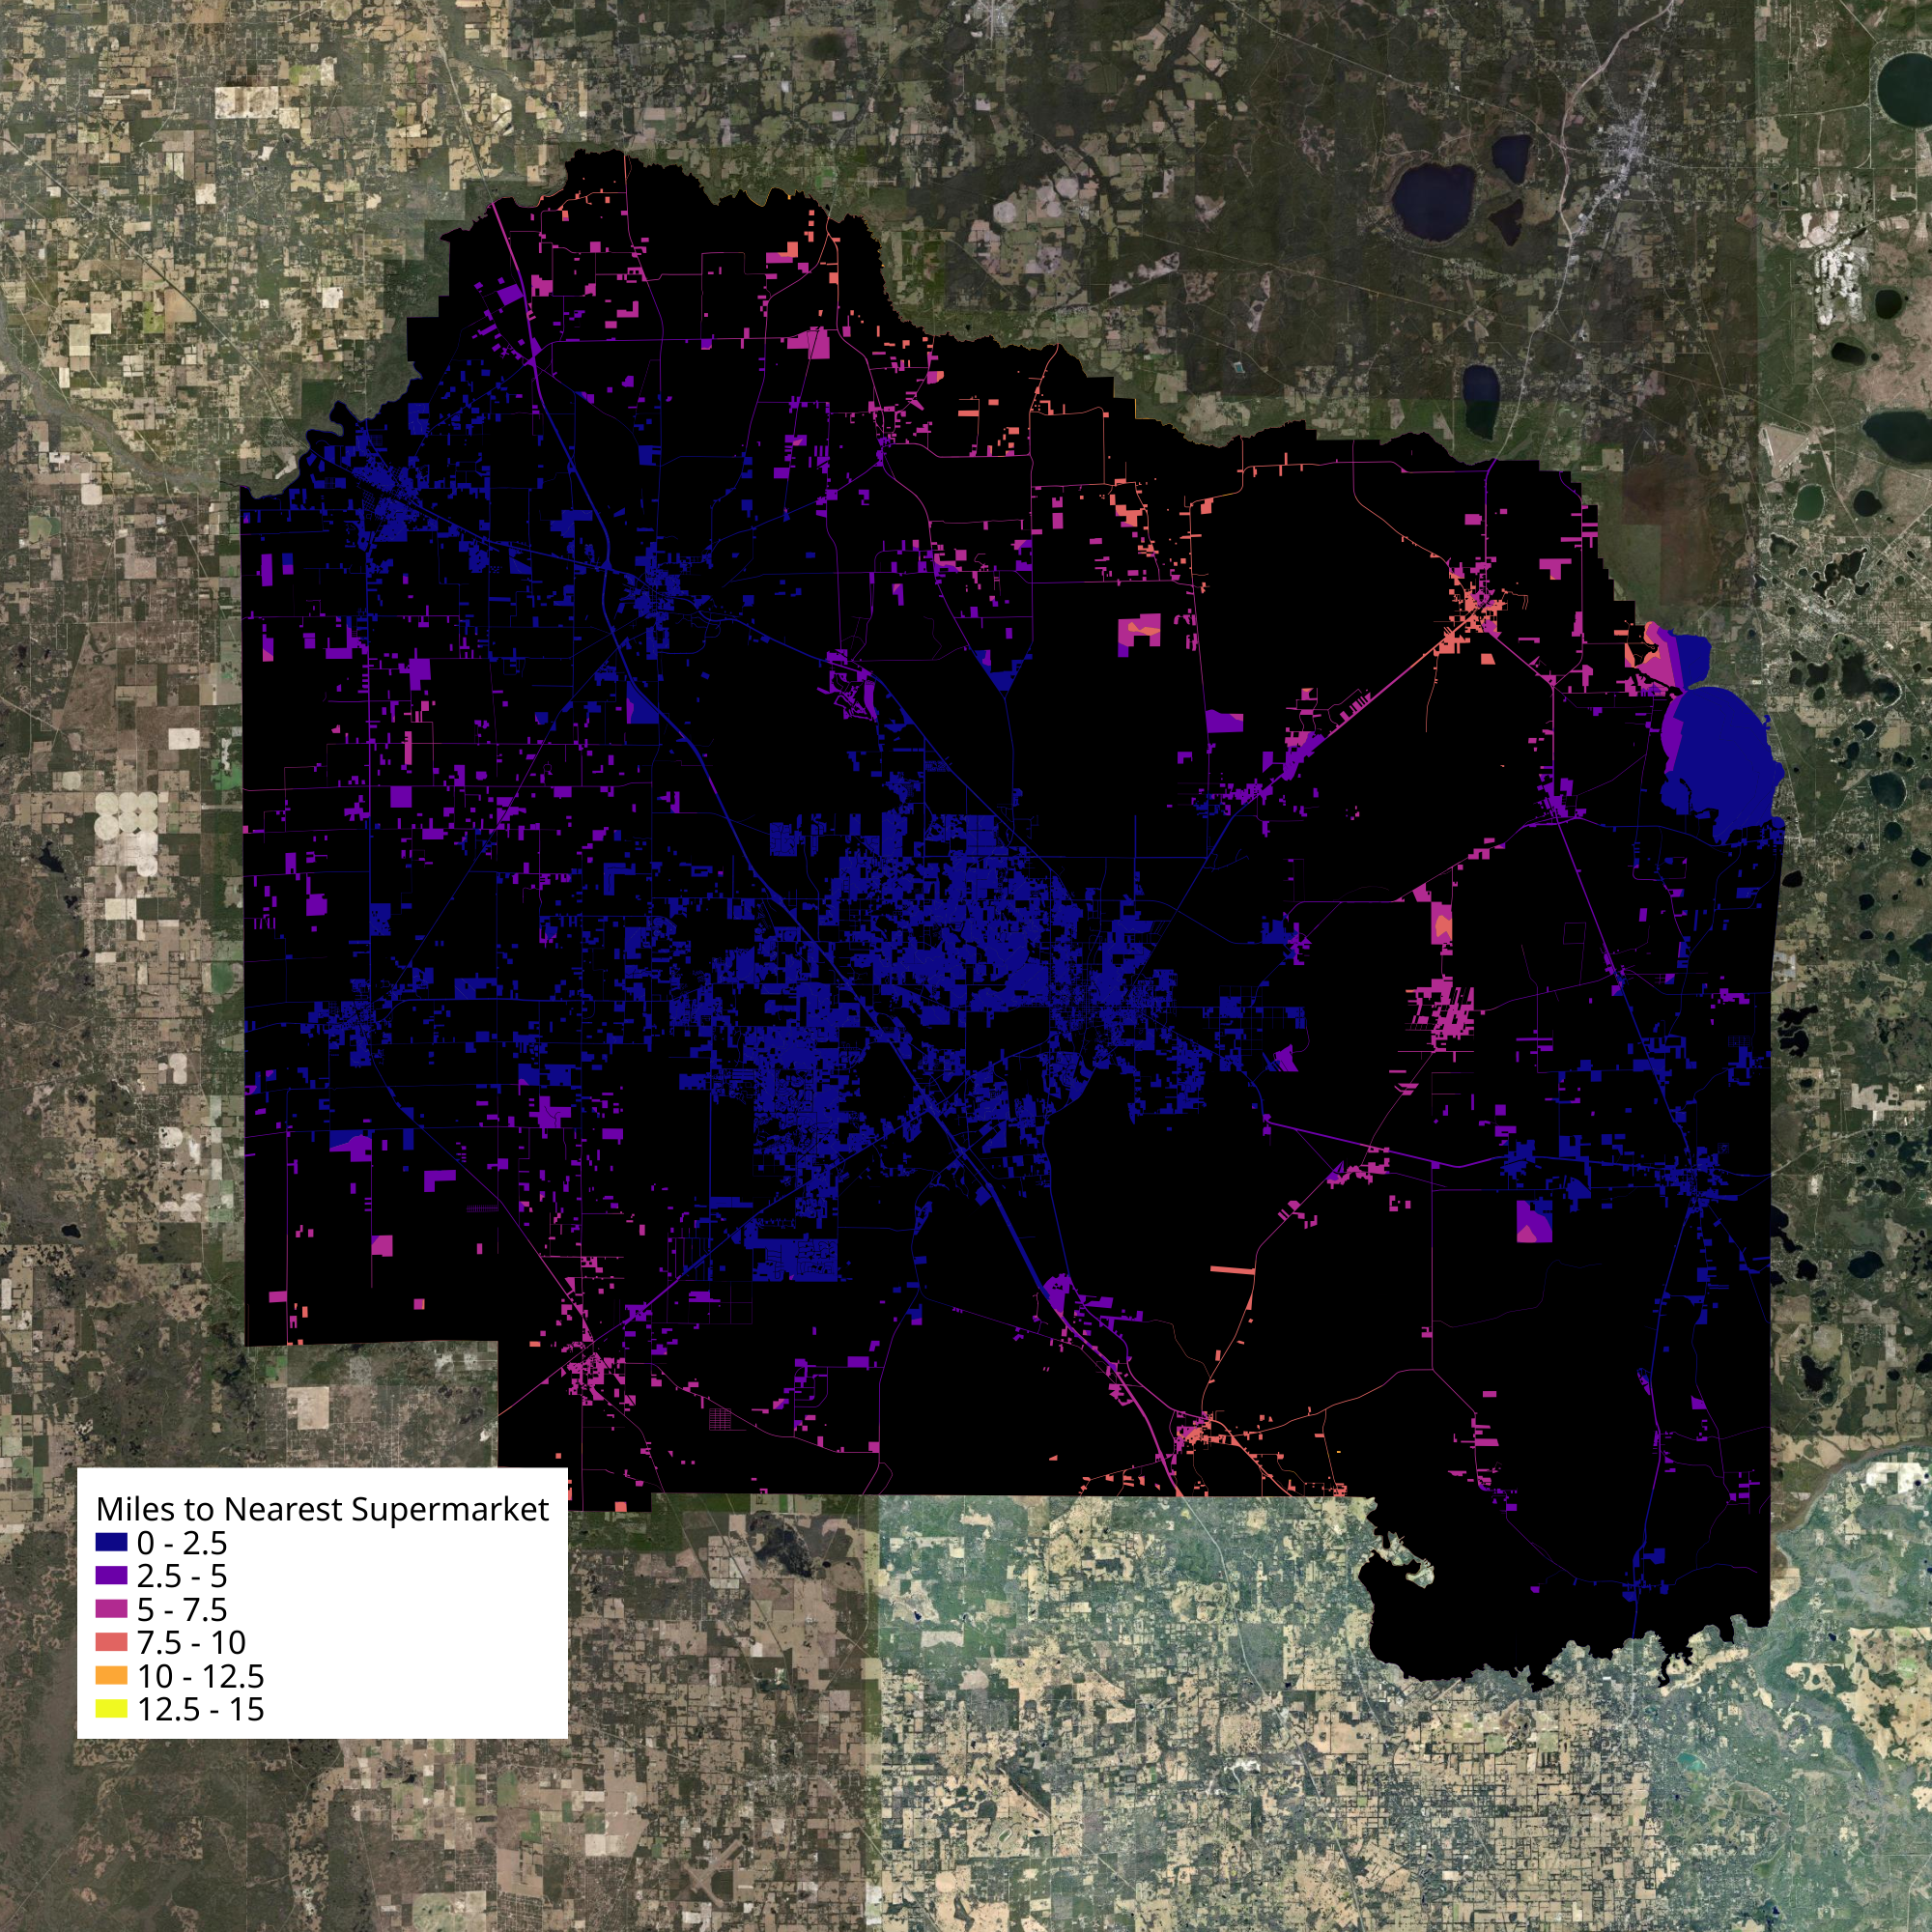
In general, food deserts are areas with low access to conventional supermarkets, while food swamps are areas where convenience stores and fast food options are more prevalent than places offering fresh produce.
I completed this research as part of my time with Free Grocery Store to identify key neighborhoods for distribution for mobile pantries.
At rural scales, Waldo and Micanopy were much further away from supermarkets than the county average.
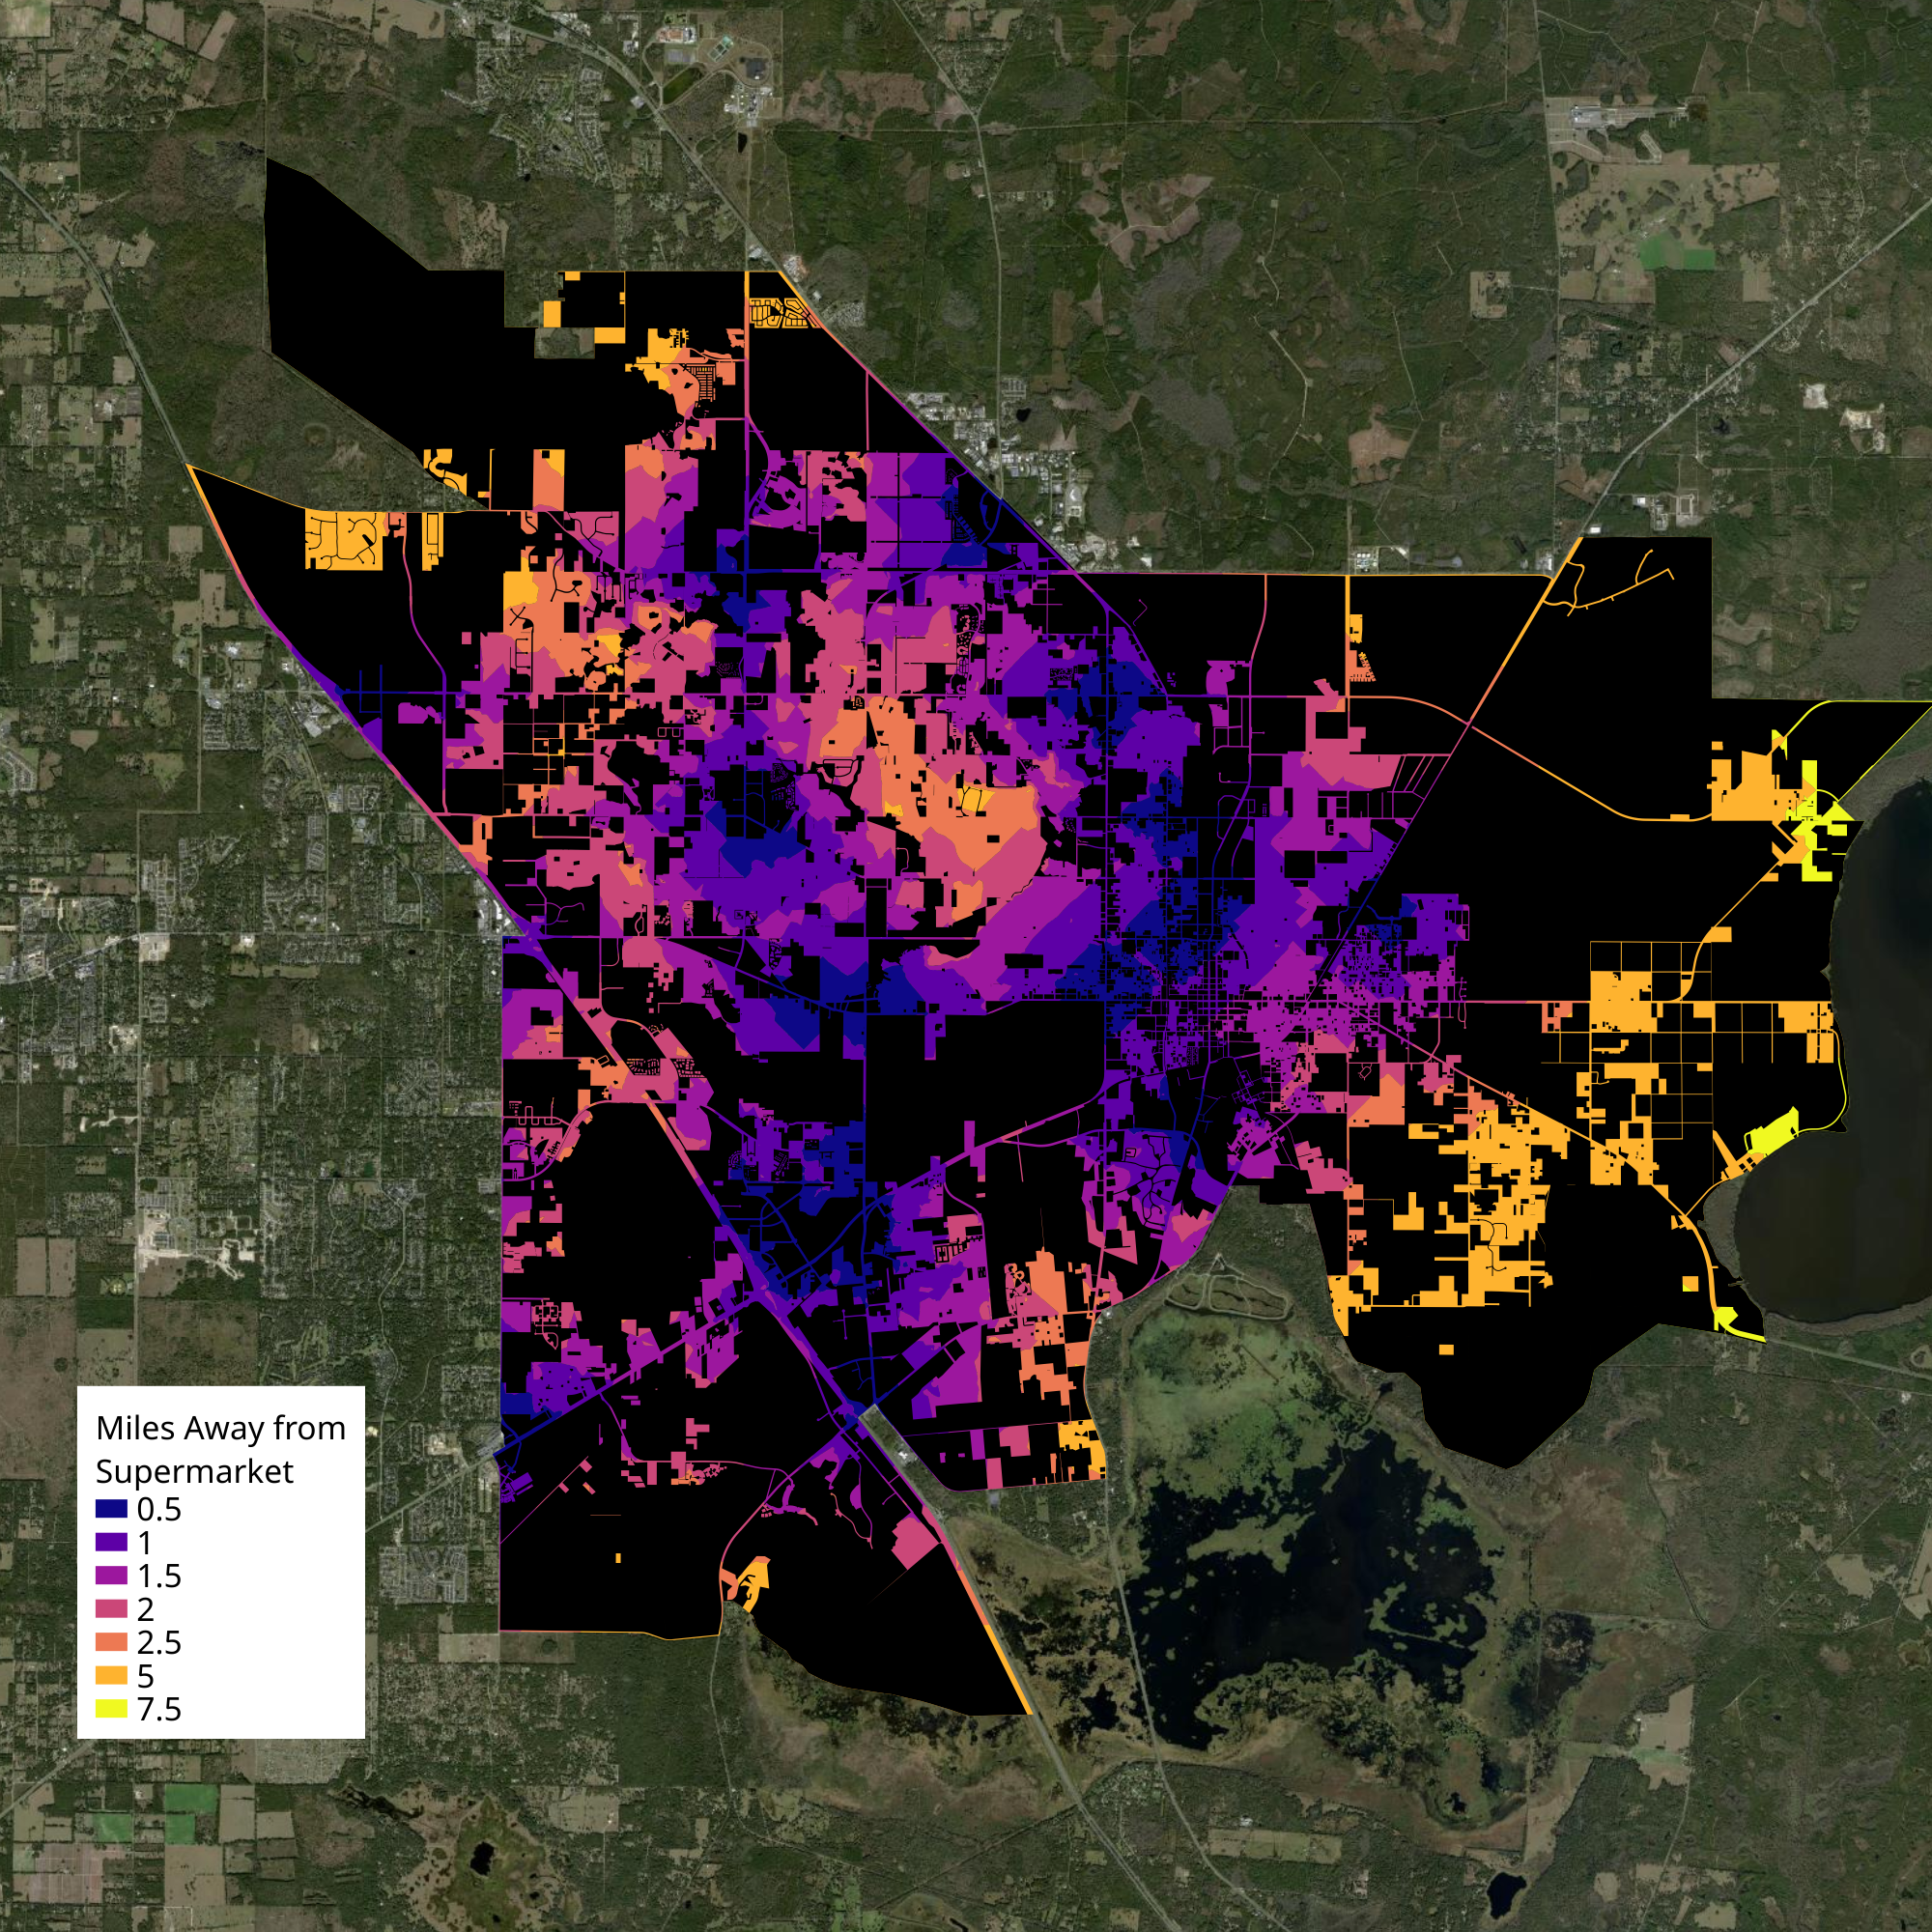
At urban scales, East Gainesville had the highest average distances away from supermarkets, with many areas more than 2.5 road miles from a supermarket. The USDA criterion for a food desert is 1 mile from a supermarket.
I mapped food swamps as well, creating a quotient that defined the ratio of road distances of the nearest convenience store to the nearest supermarket. The measure is relative - it should be compared to what is typical across the county.
At rural scales, most rural areas outside of the cities of Alachua and Newberry have poor access to quality food resources.
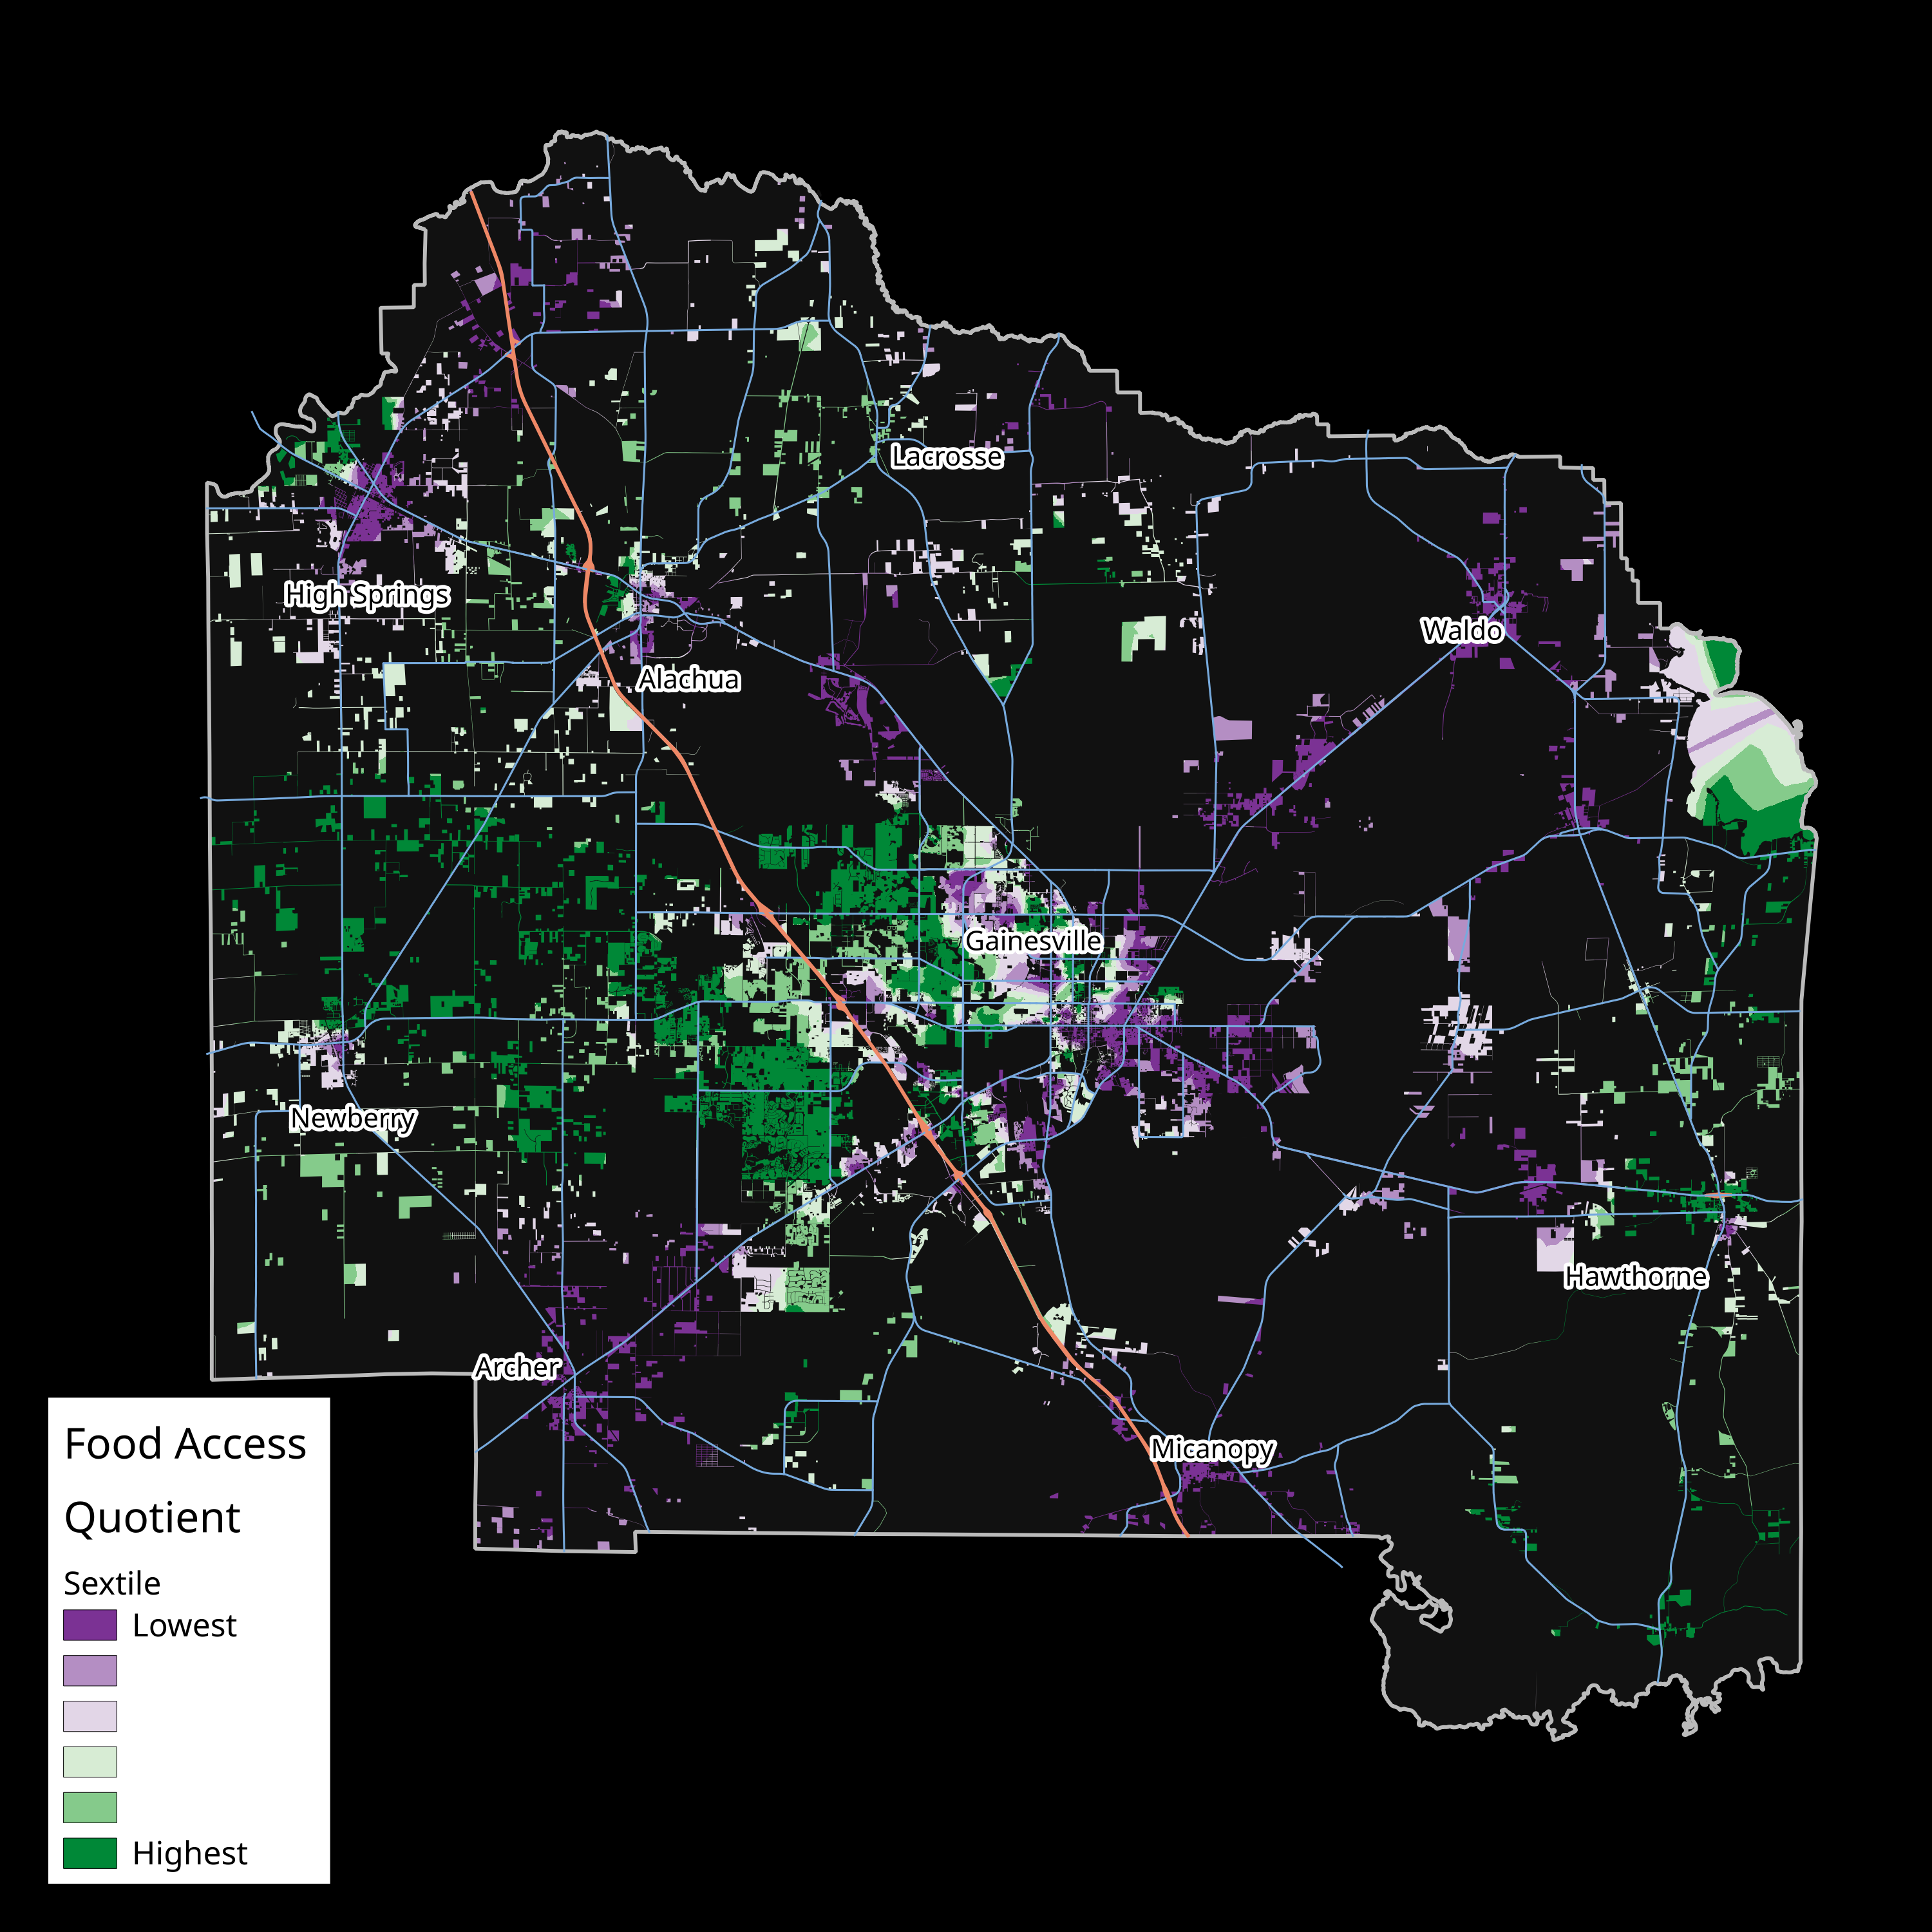
At the urban scale, East Gainesville generally had low food access quotients, while healthy food options were more available in Northwest Gainesville and an area between Tower and Parker roads in West Gainesville.
Evictions in Alachua County
Spatial analysis of 20 years of Alachua County evictions.

This project was motivated by my time as Housing Campaign Coordinator with the Alachua County Labor Coalition. I wanted to describe where clusters of evictions occurred in Alachua County to focus efforts on identifying shitty landlords. I also wanted to identify newly emerging clusters, permanent clusters, and determinants of eviction clusters.
Using scraped data from the Alachua County Clerk or Court, I geocoded eviction addresses using E911 data. I joined demographic and structural variables to create aggregation clusters.
Using Anselin Local Maran's I, I found two major high-eviction clusters: a small band surrounding Alachua and a band in Gainesville from Holly Heights and Sparrow Condomiums to Phoenix and SW 35th Place. At the rural scale, much of the core of the City of Alachua emerges as a hotspot.
Using a model, I found that race and housing types were the most effective determinants of eviction clusters. More white people and single-family detached housing were associated with lower rates of eviction, while single-family attached units were associated with higher rates of eviction.